Relevant Commentary, all information Philly (real estate and otherwise), Open Houses, Listings, Happenings, and More — by Jeff “City” Block
|
Philly Single Family Home Data Analysis
|
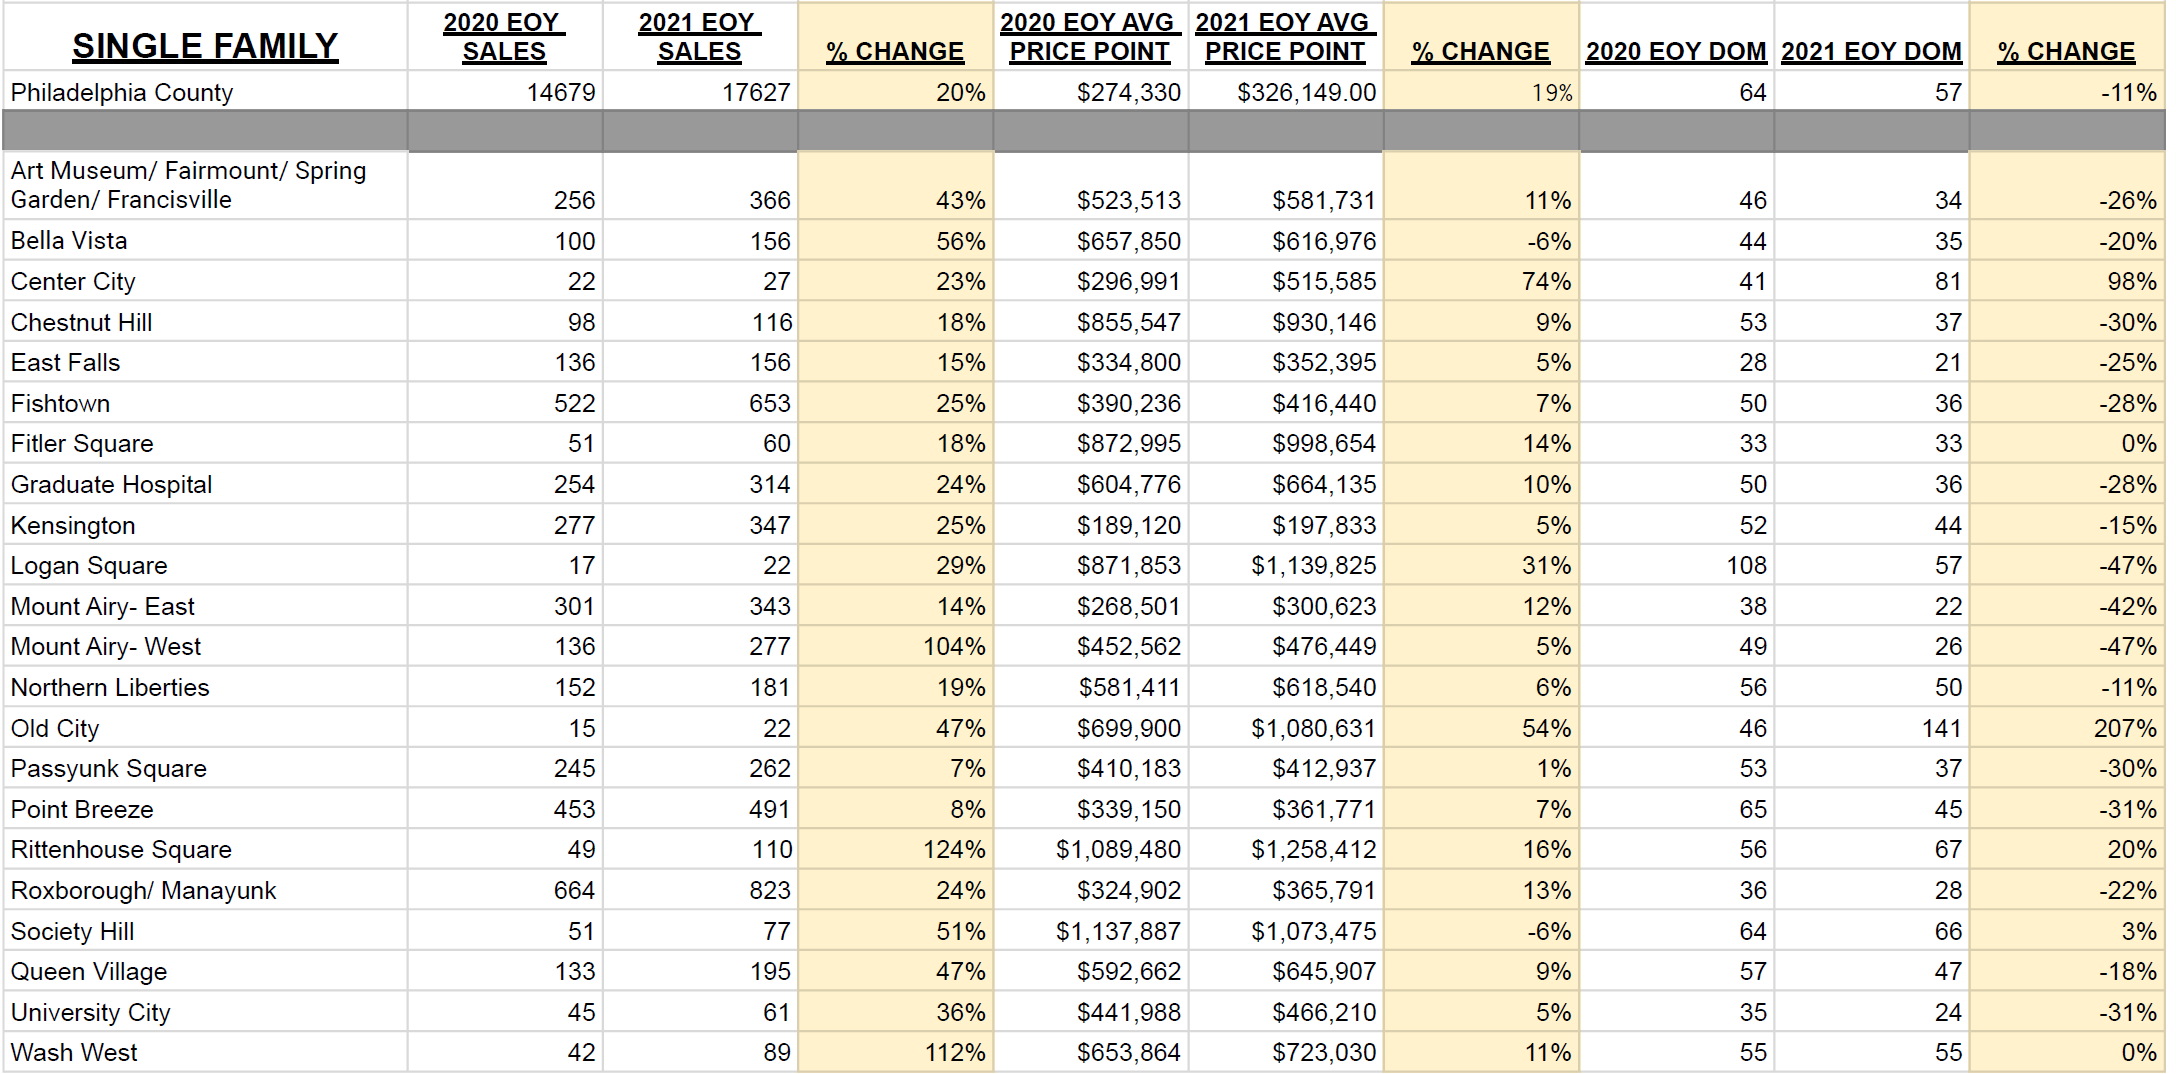
Two weeks ago, I gave an overview of the 2020 and 2021 Markets and provided these three charts to differentiate between residential single family homes, condos, and multi-units. This week, I want to focus on single family homes and delve into the neighborhoods. Single family homes represent the vast majority of sales in Philly. For example, in 2021, there were 17,627 single family sales compared to 3,726 condo and multi-family sales combined!
So, the crux of the Philly sales data and the larger sample sizes are found with single family listings. Single family includes primarily townhomes, as that is the most common Philly housing stock, though UCity and the Northwest also include twins and singles.
|
End of Year 2021, showed a 19% increase in average sales price compared to EOY 2020. And this is coming after multiple years in a row of successive price increases. Incredible. The average price in the city increased from just under $275,000 to just over $325,000. That is the city as a whole. In the neighborhoods the City Block Team primarily serves, 20 out of 22 are above this number—most well above. This makes sense as the CBT average sale price in 2021 was $597,650 ($129,092,554 volume with 216 sales).
Of the neighborhoods listed on our chart, the least expensive is Kensington at just under $200,000. And East Mt Airy was just above that at $300,000. Everything else was way above the average, including Rittenhouse Square coming in above $1.25M. Logan Square and Old City also came in above $1M with smaller sample sizes. Not surprising as both of these neighborhoods have high-end new and newer construction communities with garage parking. Society Hill was also above $1M. None of these are a surprise. I was surprised that Fitler Square was not above $1M, but then it did come in at $998,654, so it was right there. And Fitler has some smaller homes that bring its average price down, yet its price per square foot is really strong. Chestnut Hill is also in the $900’s.
With respect to the 2020 to 2021 year-to-year percentage change, 20 of 22 neighborhoods increased in value. 10 out of 22 neighborhoods were between a 7% and -6% change. While a +-6% appreciation change in one year is not minuscule, based on a smaller sample size in some of these neighborhoods, it is really not too significant. A few big sales or perhaps several shells selling at a lower price could make up for much of this. For example, I do not believe that Bella Vista’s 156 sales and a sale price depreciation of 6% means that Bella Vista really went down in value. In fact, I would venture that the exact same house I sold in Bella Vista in 2020 would have actually sold for more in 2021 (and certainly would in 2022 as well). Further evidence of this can be found by looking at its adjacent neighborhood. Queen Village and its 195 2021 sales were up 9%. And both neighborhoods average in the mid-$600’s. It simply does not make sense that Queen Village is up 9% and Bella Vista down 6% except for statistical anomaly. These two neighborhoods are certainly not the exact same, but they are adjacent and nothing material changed between 2020 and 2021 in their respective characteristics that would account for this disparity. Finally, here is the real proof. Let’s take a sneak peek at the condo values in BV and QV. In condo sales, Bella Vista is actually up 13% while Queen Village is down 7%. Again, this makes no sense except for statistical anomaly based on a smaller sample size.
So yes, when we break down by neighborhood, the sample sizes are small, but they are still fun to look at. How about Old City, a neighborhood of primarily condos? Only 22 homes sold in 2021 compared with a mere 15 in 2020. And a 54% increase in price, the largest on the list by far. Why could that be? Well check this out, Old City also had a 207% increase in days on market (DOM). By far the highest DOM change. In fact, with the market appreciating, DOM is typically down, and this bears out in the city with an 11% DOM reduction in most every other neighborhood. Except Old City has the highest appreciation and a titanic increase in DOM. Again, why? The answer is very expensive, large, luxury new construction. New construction sells for more and typically takes much longer to sell. It is obvious why it sells for more. Brand new, real nice, Tax Abatement. But why longer to sell? New construction is typically marketed while it is under construction. Sometimes even before it breaks ground. It is harder to sell something that may be months, if not a year plus out. Also, new construction developments have multiple properties to sell. So, you could have multiple properties listed for months, and even when a few sell, others remain, waiting to be sold. A highly successful new construction development will often take a year plus to sell out, thus increasing DOM. We will see this same situation next week when I discuss condo sales in Mount Airy.
With inventory at historic lows, we still had 20% more single family sales in 2021 than 2020. Keep in mind that we only had sales for approximately nine months of 2020. The latter part of 2020 was a remarkable year under the circumstances, and I will say the same for 2021 as well. What crazy times.
If you have any questions about your neighborhood (or block), this data, or the Philly market in general, please reach out.
|
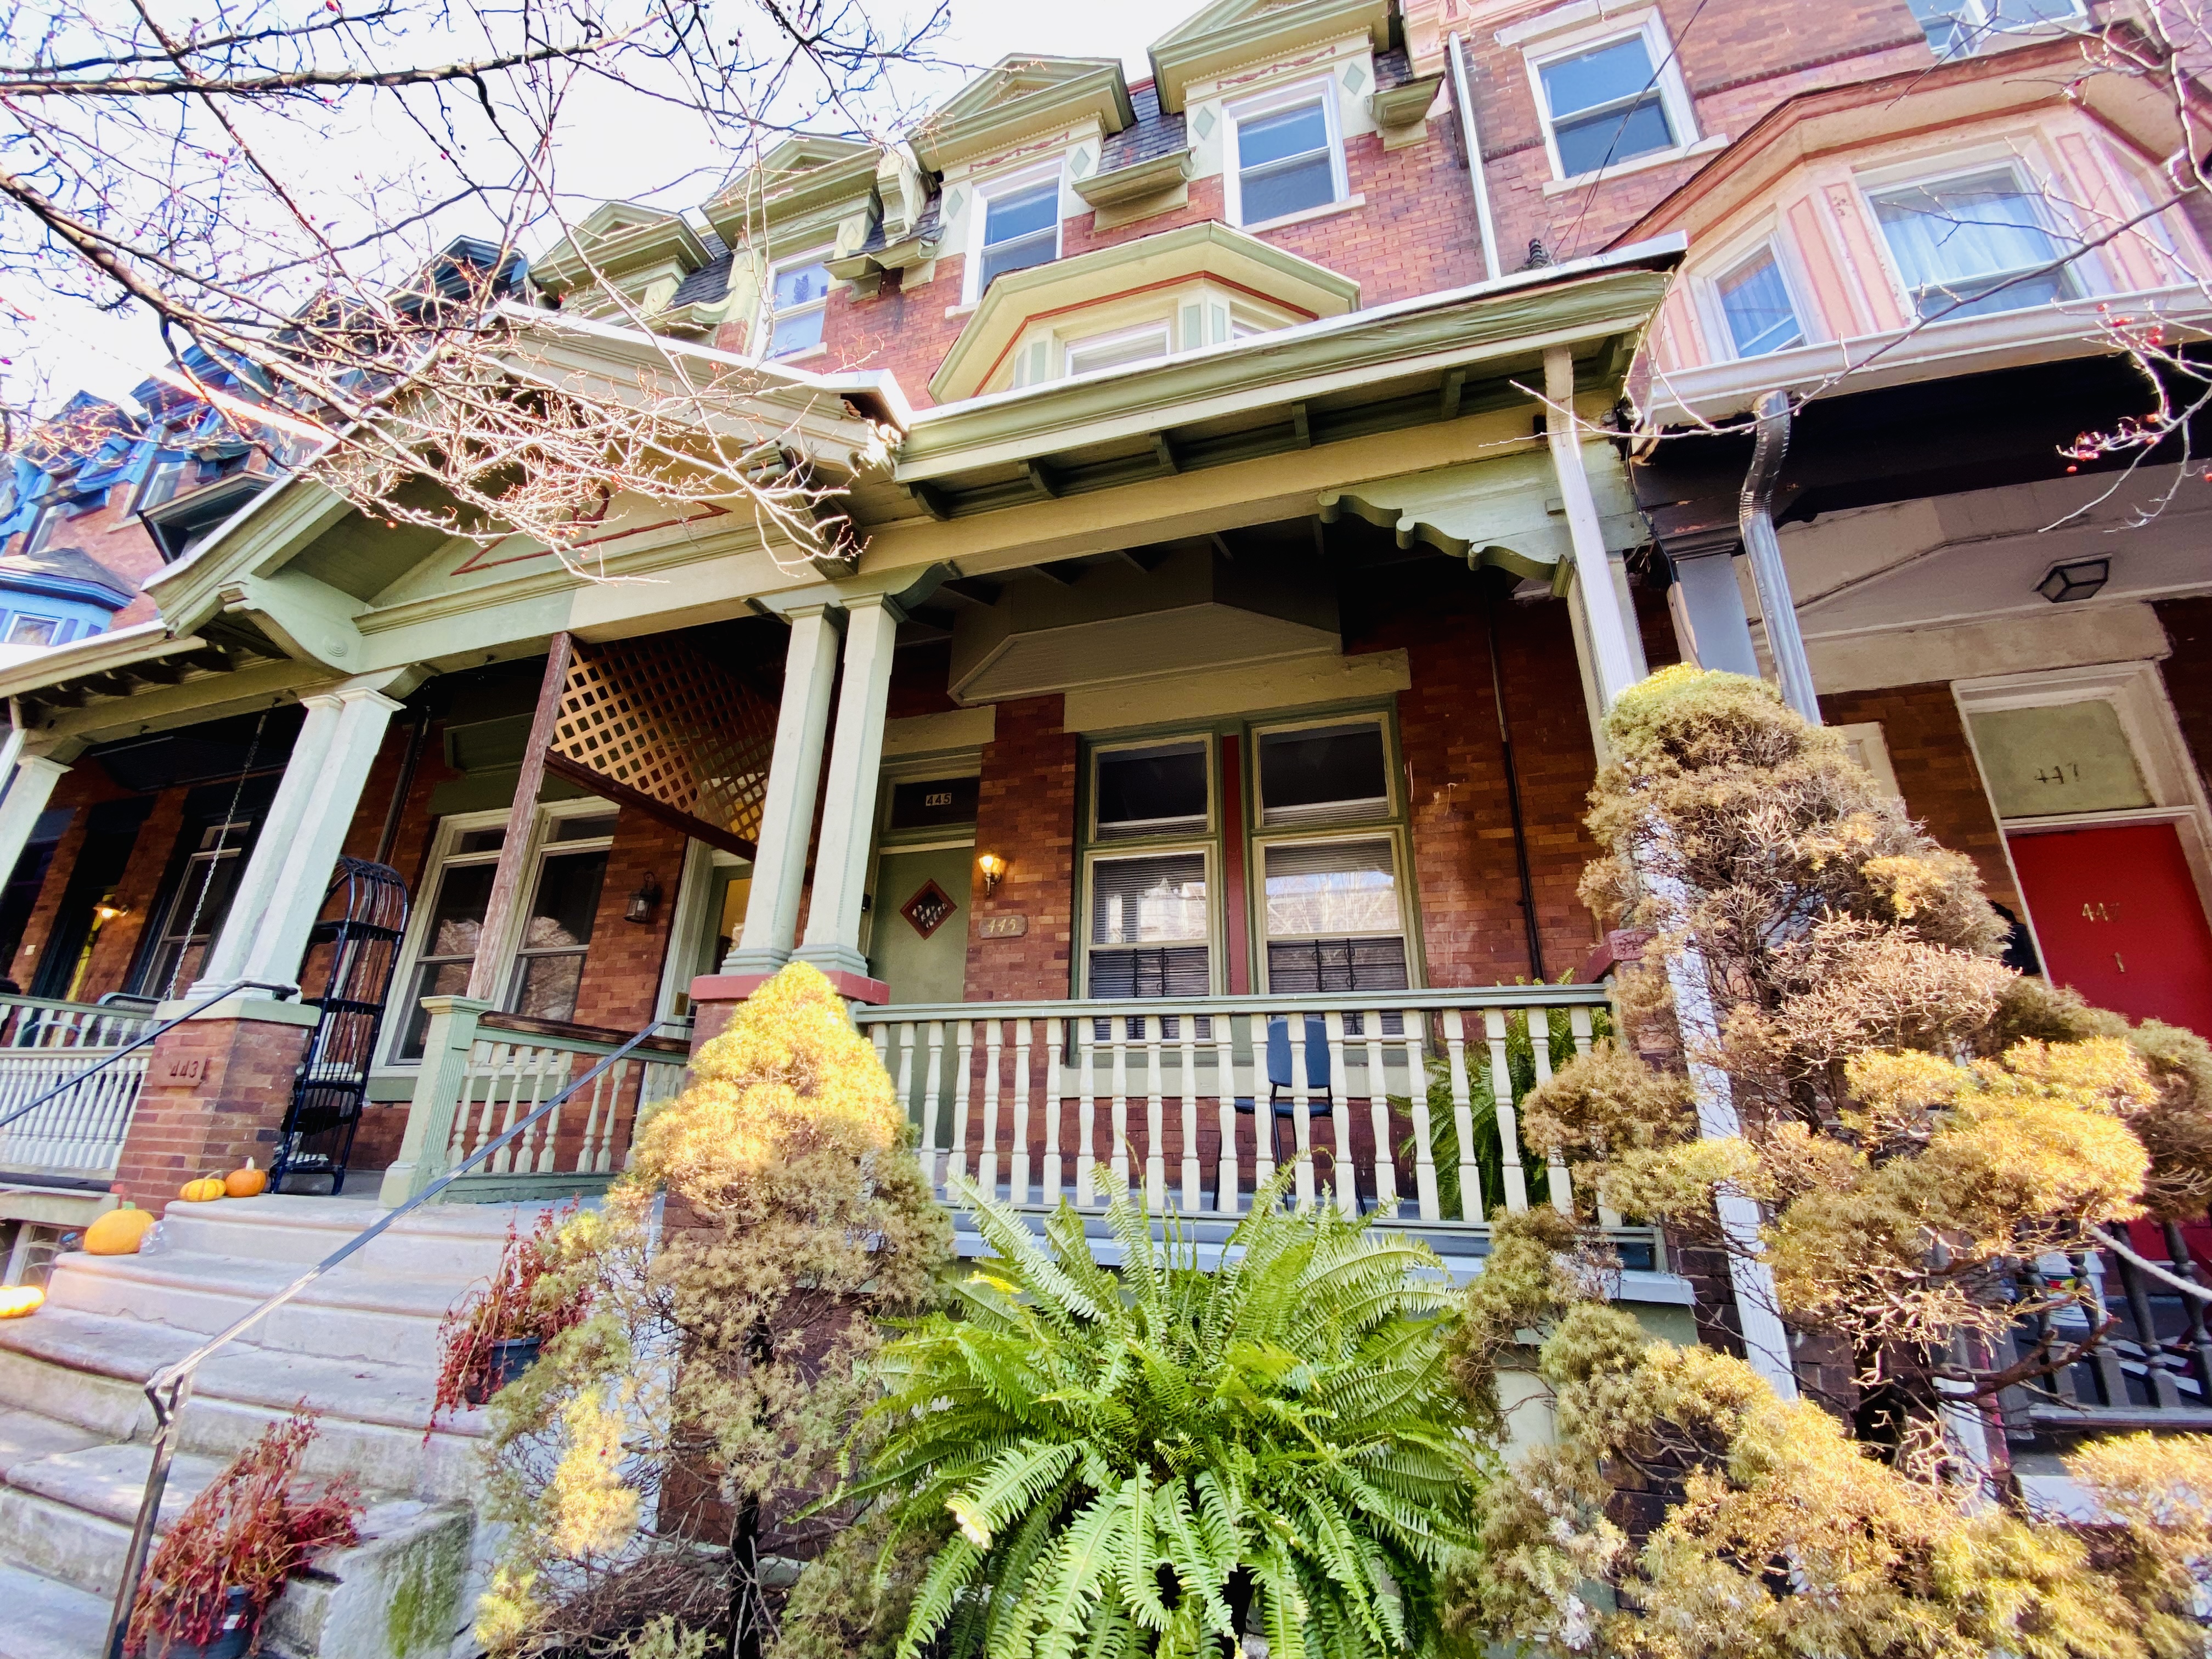
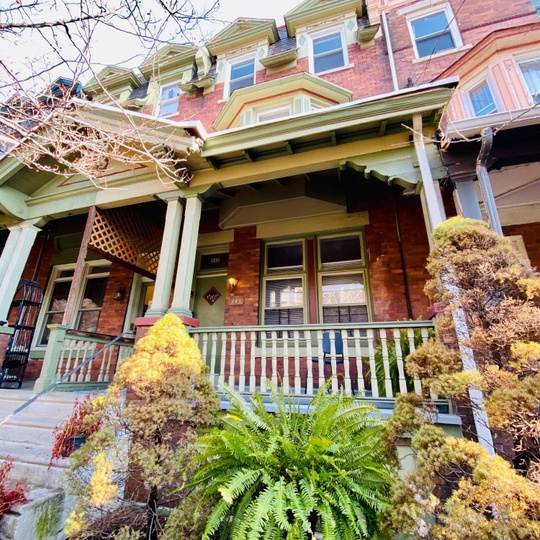
6 BD | 2.5 BA | 2,880 SF | Victorian Porch | Patio | Penn Alexander Catchment | $650,000
Opportunity Knocks! Ideal property for someone seeking a mid-range rehab and looking to build sweat equity in RED HOT SPRUCE HILL.
Beautifully situated on a tree-lined street, this 6 BEDROOM, 2.5 BATHROOM Victorian porch-front home sits within the award winning Penn Alexander catchment and boasts loads of original charm, including coveted original trimming, built-in closets, a gorgeous craftsman staircase, stained glass windows, city and architectural views, bay windows, a main floor powder room and laundry room, high ceilings, ceiling fans, and a spruced up EXTRA LARGE, DEEP AND OPEN BASEMENT that’s perfect for finishing to add more living space.
A front garden and good-sized patio complete this home. Also, notice the center city skyline view from the rear 3rd floor window. This home has excellent roofdeck potential.
All within a quick walk to the shops, restaurants and trolleys of Baltimore Ave., Clark Park and its year round farmers market, Woodlands, grocery stores, hospitals, University Swim Club, the Bird Sanctuary, and more! You’ll also find it’s an easy commute into the hustle and bustle of Center City, UPenn, University of the Sciences, Drexel University, Philadelphia International Airport, and the Main Line. This is an area that has architectural and historical significance, great walkability and a well-established community that continues to thrive. Welcome home!
|
|
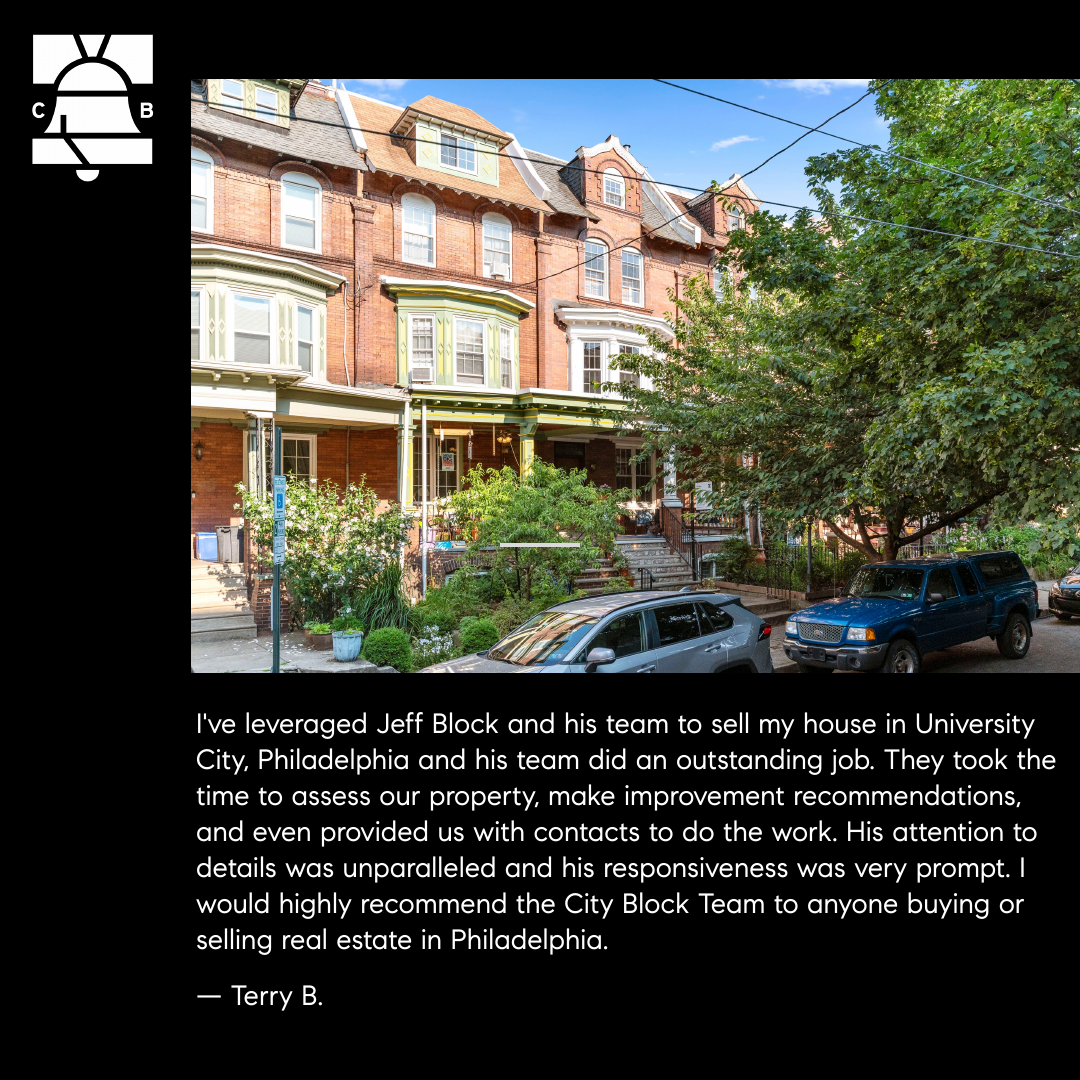
What are my Clients Saying?
|
|
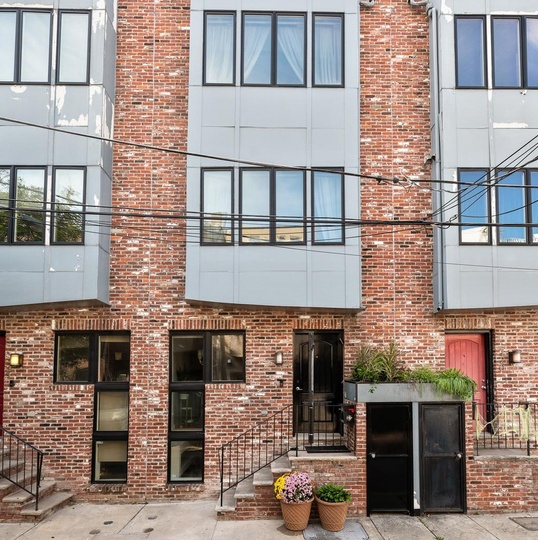
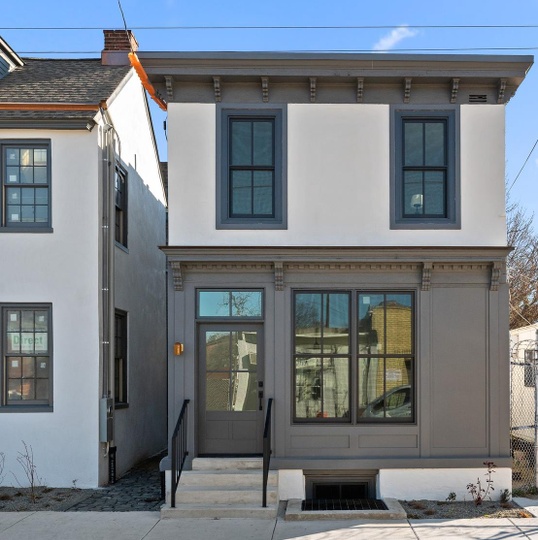
Mount Airy
New Construction
|
3 Bed | 2.5 Bath
$770,000
|
|
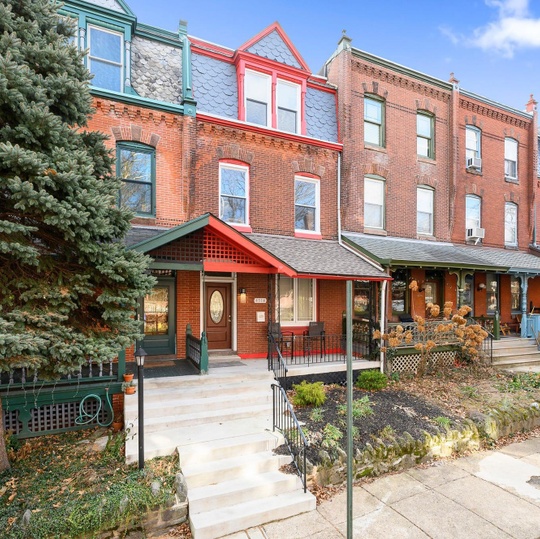
4514 Regent Street
NEW LISTING
4 Bed | 3.5 Bath
$700,000
|
6 Bed | 2.5 Bath
$650,000
|
|
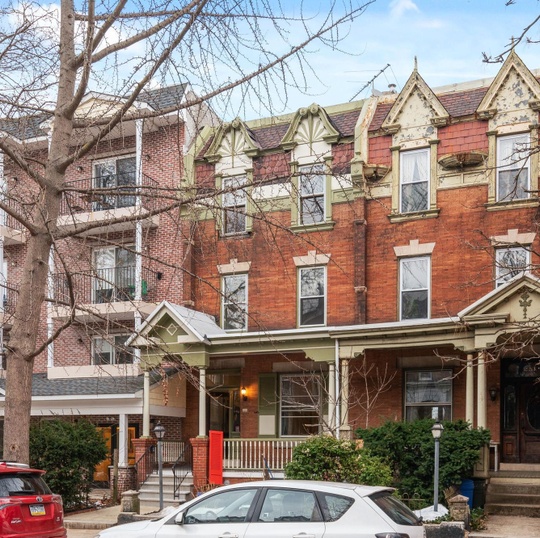
3 Bed | 2.5 Bath
$625,000
|
5 Bed | 2.5 Bath
$595,000
|
|
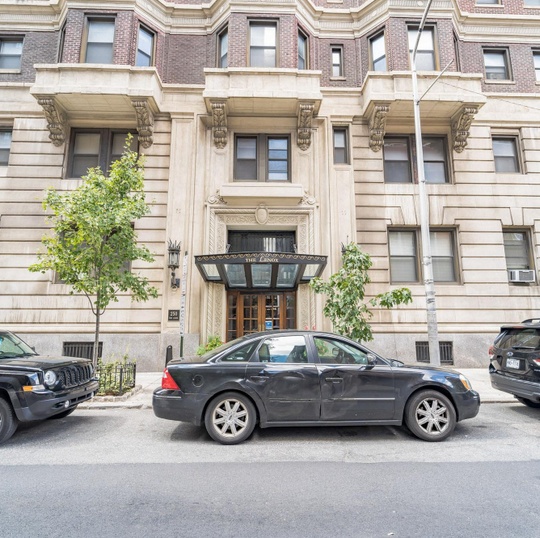
2 Bed | 2.5 Bath
$450,000
|
250 S 13th Street, Unit 8F
|
|
As always, please know that I’m humbled by and appreciative of your introductions and referrals. If you have a friend, colleague, or family member that is in need of Expert Real Estate Representation, please have them contact me.
Be assured, I will do my best to exceed their expectations! Thanks for taking the time to read this issue of Around the Block.
|
|
Some imagery in this e-newsletter was sourced via Canva.
|
marketingcenter-greaterphiladelphia-philadelphia
|


 By submitting information, I am providing my express written consent to be contacted by representatives of this website through a live agent, artificial or prerecorded voice, and automated SMS text at my residential or cellular number, dialed manually or by autodialer, by email, and mail.